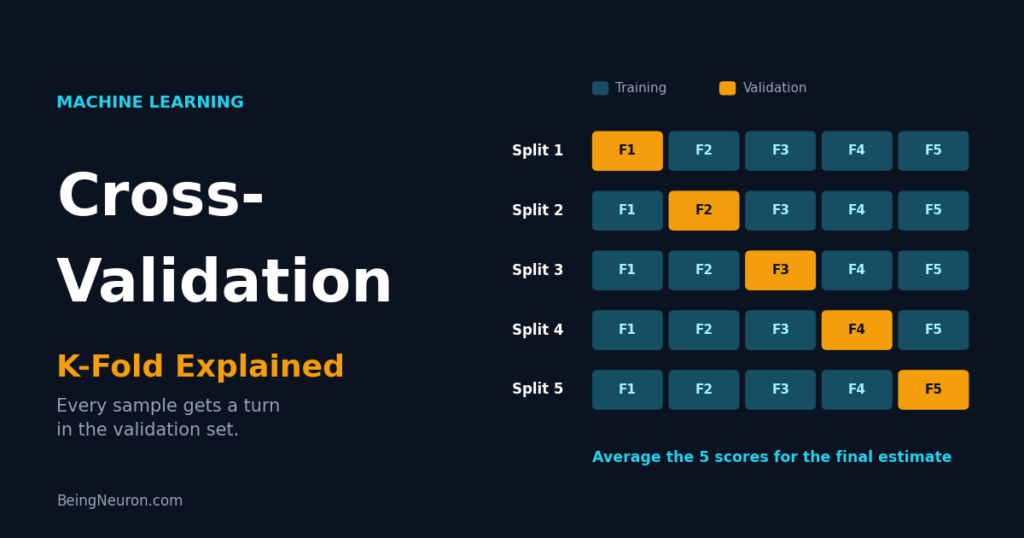
Supervised machine learning with Python is easier to start than most beginners expect. In about 40 lines of code, you can load a dataset, explore it, split it fairly, compare two models, train the better one, and measure how well it predicts on unseen data. This tutorial walks through that entire workflow with scikit-learn, one step at a time. You will build a classifier that identifies the grape variety (cultivar) of a wine from 13 chemical measurements. Along the way, you will learn good habits that professionals use, such as keeping a hidden test set and putting preprocessing inside a pipeline so that no test information leaks into training. If the vocabulary is new, skim What Is Supervised Learning? first. Table of contents What you will build Step 1: Set up your environment Step 2: Know your Python libraries Step 3: Load the dataset Step 4: Explore the data Step 5: Split into training and test sets Step 6: Choose a model with cross-validation Step 7: Train the model and make predictions Step 8: Evaluate the results Troubleshooting common problems What to try next Frequently asked questions Conclusion What you will build The project is a classification task. The target has three classes, and each wine sample belongs to exactly one. To review the task types, see Classification vs Regression in Machine Learning. The plan has eight steps: Set up Python and install the libraries. Load the wine dataset. Explore the data. Split it into training and test sets. Compare two candidate models using cross-validation on the training data. Train the chosen model. Predict on the test set. Evaluate with accuracy, a confusion matrix, and a classification report. The dataset is small on purpose. It contains 178 samples, it ships with scikit-learn, and the code runs in seconds on any laptop. Step 1: Set up your environment Install a recent version of Python 3 from python.org or through your system’s package manager. Then create a virtual environment, which is an isolated folder of packages for one project. This keeps your tutorial libraries from clashing with other work. python -m venv .venv # Activate it on macOS or Linux: source .venv/bin/activate # Activate it on Windows (Command Prompt): .venv\Scripts\activate pip install scikit-learn pandas Check that the install worked: python -c “import sklearn, pandas; print(sklearn.__version__, pandas.__version__)” If this prints two version numbers, you are ready. You can also work inside Jupyter Notebook or Google Colab, where scikit-learn and pandas are usually available already. The scikit-learn project documents installation options on its install page, linked in the references. Step 2: Know your Python libraries This tutorial uses two main libraries: scikit-learn (imported as sklearn) provides datasets, preprocessing tools, models, and evaluation metrics. Its models share the same interface: fit() to train and predict() to make predictions. pandas provides the DataFrame, a table that makes exploration easy. Scikit-learn depends on NumPy, which pip installs automatically. If you want charts later, add matplotlib as well. The code in this tutorial does not need it. Step 3: Load the dataset The wine dataset contains chemical analysis results for wines grown in the same region of Italy by three different cultivars. Each row is one wine. The 13 feature columns include alcohol, flavanoids, and color intensity. The target column is the cultivar, labeled 0, 1, or 2. Setting as_frame=True returns the data as a pandas DataFrame. import pandas as pd from sklearn.datasets import load_wine wine = load_wine(as_frame=True) df = wine.frame print(df.shape) The next block runs the first exploration steps, so keep reading before running them separately. Step 4: Explore the data Exploratory data analysis (EDA) means looking at your data before modeling. You want to learn how big it is, whether classes are balanced, whether values are missing, and what ranges the features cover. Add these lines to the same script: print(df[“target”].value_counts().sort_index().to_dict()) print(“missing values:”, int(df.isna().sum().sum())) print(df[[“alcohol”, “flavanoids”, “color_intensity”]].describe().loc[[“mean”, “min”, “max”]].round(2)) When I ran these lines with Python 3.12, pandas 3.0.2, and scikit-learn 1.8.0, the output was: (178, 14) {0: 59, 1: 71, 2: 48} missing values: 0 alcohol flavanoids color_intensity mean 13.00 2.03 5.06 min 11.03 0.34 1.28 max 14.83 5.08 13.00 This tells you four useful things: The table has 178 rows and 14 columns: 13 features plus the target. The three classes hold 59, 71, and 48 samples. They are not perfectly equal, but none is rare, so plain accuracy is a reasonable starting metric. We will still check per-class results. There are no missing values, so we do not need an imputer. Real datasets often do need one. The features live on very different scales. Color intensity reaches 13, while flavanoids stay mostly below 5. This matters for scale-sensitive models such as logistic regression, so we will scale the features. Step 5: Split into training and test sets Now separate the features from the target and hold out a test set. The model will never see the test set until the very end. This step must come before any scaling or tuning, so no test information leaks into training. The article on training data vs testing data explains the reasoning. from sklearn.model_selection import train_test_split X = df.drop(columns=”target”) y = df[“target”] X_train, X_test, y_train, y_test = train_test_split( X, y, test_size=0.2, stratify=y, random_state=42) Three details matter here. test_size=0.2 reserves 20% of the rows for testing. stratify=y keeps the class proportions the same in both parts. random_state=42 makes the split repeatable, so you get the same result each time. Step 6: Choose a model with cross-validation You rarely know in advance which algorithm works best, so compare a few. We will test two: logistic regression, a simple and fast linear classifier, and a random forest, a flexible ensemble described in Random Forest vs Decision Tree. The logistic regression model goes inside a pipeline with a StandardScaler. A pipeline chains steps together, and when you cross-validate it, scikit-learn refits the scaler on the training folds only. That prevents scaling information from leaking from the validation fold. The random forest does not need scaling. from sklearn.pipeline import make_pipeline