
K-Means Clustering Explained with Examples and Python
Understand K-means clustering: centroids, assignment, initialization, the elbow method, silhouette score, limits, and full Python code from scratch.
 Oct 29, 2026Published
12 min readReading time
K-means clustering is the most widely used clustering algorithm in machine learning. It splits a dataset into K groups by repeatedly assigning each point to its nearest group center and then moving each center to the average of its points. The idea fits in two sentences, it runs fast on large datasets, and it is available in every major machine learning library.
This article explains how K-means works step by step, shows the math behind it, and walks through three practical decisions: how to initialize, how to choose K, and when K-means is the wrong tool. You will also write K-means from scratch in NumPy and then use scikit-learn on the same data. If you are new to the topic, read How Unsupervised Learning Works first, because K-means depends on the distance ideas explained there.
What Is K-Means Clustering?
K-means is an unsupervised, centroid-based clustering algorithm. You choose a number K. The algorithm returns K clusters, each described by a centroid, which is the mean position of all the points in that cluster. The name comes from K clusters and their means.
K-means fits a simple picture of the data: each cluster is a roughly round blob, and each point belongs to the blob whose center is nearest. When the data really looks like that, K-means works very well.
How the K-Means Algorithm Works
The standard algorithm is called Lloyd’s algorithm. It has four steps.
- Initialize. Choose K starting centroids, for example K random data points.
- Assign. Compute the distance from every point to every centroid. Give each point the label of its nearest centroid.
- Update. Move each centroid to the mean of all points currently assigned to it.
- Repeat. Go back to step 2. Stop when assignments no longer change or centroids move less than a small tolerance.
Each pass through steps 2 and 3 can only keep the objective the same or lower it, so the algorithm always converges. It may converge to a local optimum, not the best possible answer, which is why initialization matters.
The objective function
K-means minimizes the within-cluster sum of squares, also called inertia or WCSS:
J = Σk=1..K Σx ∈ Ck ‖x − μk‖²
Here Ck is the set of points in cluster k and μk is its centroid. The formula adds up the squared distance from every point to the centroid of its own cluster. Small J means compact clusters.
The update step follows directly from this objective. For a fixed assignment, the point that minimizes the sum of squared distances to a set of points is their mean:
μk = (1 / |Ck|) Σx ∈ Ck x
Watching the centroids move
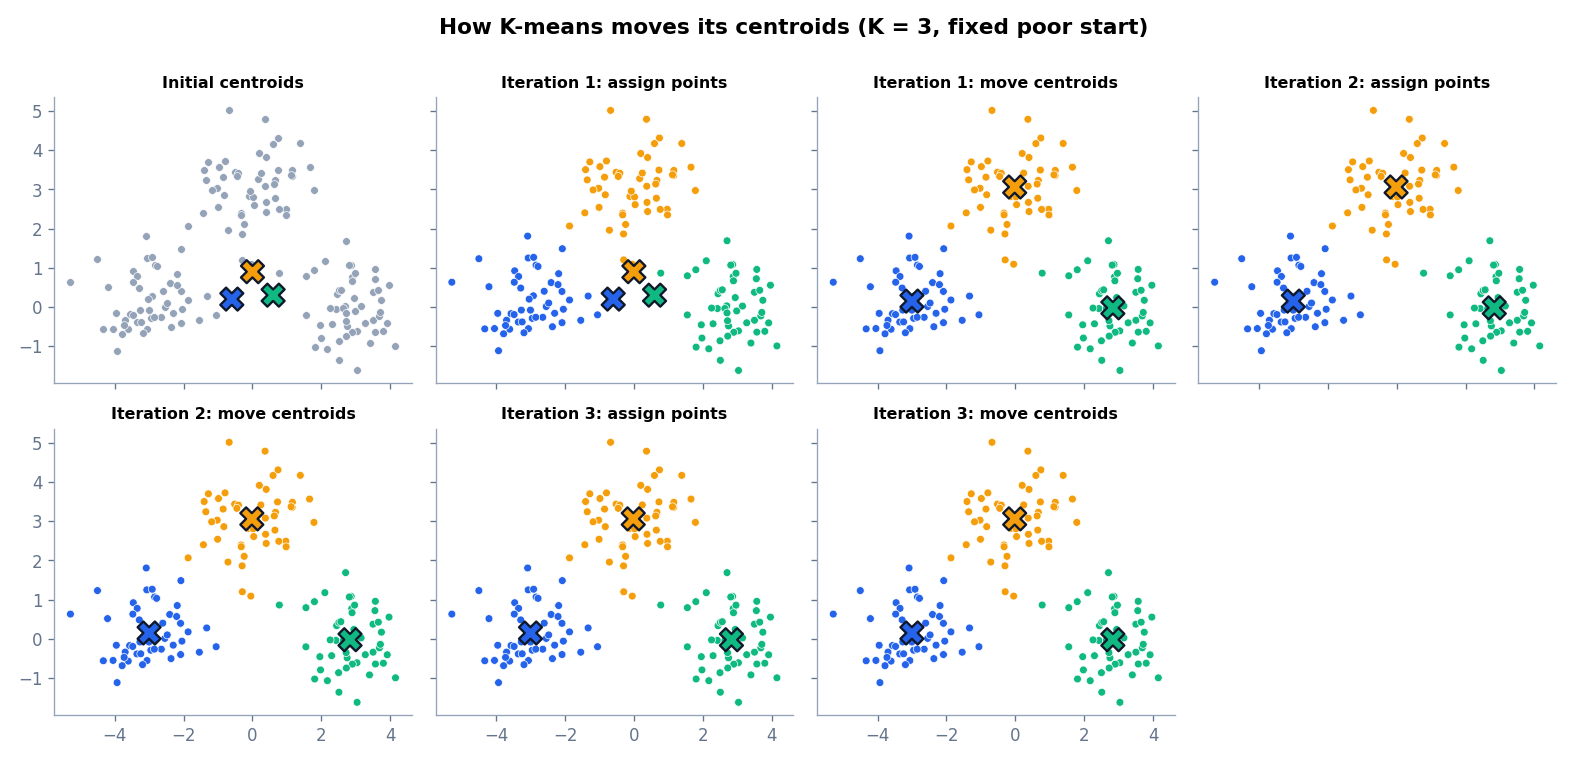
The figure starts with three centroids placed close together near the middle of the data. After the first assignment, each centroid claims a slice of the data. The update step moves each centroid to the center of its slice. After two or three rounds, each centroid sits at the center of a real group, and further rounds change nothing.
One Iteration by Hand
A small example makes the loop concrete. Take six points: (1, 1), (2, 1), (1, 2), (8, 8), (9, 8), and (8, 9). Choose K = 2 and start with the centroids c1 = (1, 1) and c2 = (9, 8).
- Assign. The first three points are far closer to c1 than to c2. For instance, (2, 1) is 1 unit from c1 and about 9.9 units from c2. The last three points are closer to c2.
- Update. The new c1 is the mean of the first three points, (1.33, 1.33). The new c2 is the mean of the last three, (8.33, 8.33).
- Assign again. Every point keeps its cluster, so the algorithm has converged.
The inertia is the sum of squared distances to the centroids: 0.22 + 0.56 + 0.56 = 1.33 for each cluster, or about 2.67 in total. Every real run follows these same steps, only with more points and more iterations.
Variants worth knowing
Mini-batch K-means updates centroids from small random batches and handles very large datasets quickly, at a slight cost in quality. K-medoids uses real data points as centers, which makes it more robust to outliers. K-modes handles categorical data. Spherical K-means uses cosine similarity for text vectors.
K-Means From Scratch in Python
Writing the algorithm yourself is the best way to see how simple it is. The function below uses only NumPy and the make_blobs helper from scikit-learn to create data.
import numpy as np
from sklearn.datasets import make_blobs

def kmeans(X, k, n_iter=100, seed=42):
    rng = np.random.default_rng(seed)
    # 1. Initialize: pick k distinct data points as starting centroids.
    centroids = X[rng.choice(len(X), size=k, replace=False)]
    for i in range(n_iter):
        # 2. Assignment: each point joins its nearest centroid.
        distances = np.linalg.norm(X[:, None, :] - centroids[None, :, :], axis=2)
        labels = distances.argmin(axis=1)
        # 3. Update: move each centroid to the mean of its points.
        new_centroids = np.array([
            X[labels == j].mean(axis=0) if np.any(labels == j) else centroids[j]
            for j in range(k)
        ])
        # 4. Stop when centroids no longer move.
        if np.allclose(new_centroids, centroids):
            print(f"Converged after {i + 1} iterations")
            break
        centroids = new_centroids
    inertia = ((X - centroids[labels]) ** 2).sum()
    return labels, centroids, inertia

X, _ = make_blobs(n_samples=300, centers=4, cluster_std=0.85, random_state=42)
labels, centroids, inertia = kmeans(X, k=4)
print("Cluster sizes:", np.bincount(labels))
print("Inertia (WCSS):", round(inertia, 1))
print("Centroids:")
print(np.round(centroids, 2))
The most important line is the distance calculation. X[:, None, :] - centroids[None, :, :] uses broadcasting to subtract every centroid from every point at once, producing an array of shape (points, K, features). np.linalg.norm(..., axis=2) turns each difference vector into a distance, and argmin(axis=1) picks the nearest centroid for each point. The list comprehension then computes each new centroid as the mean of its points and keeps the old centroid if a cluster becomes empty. Output:
Converged after 3 iterations
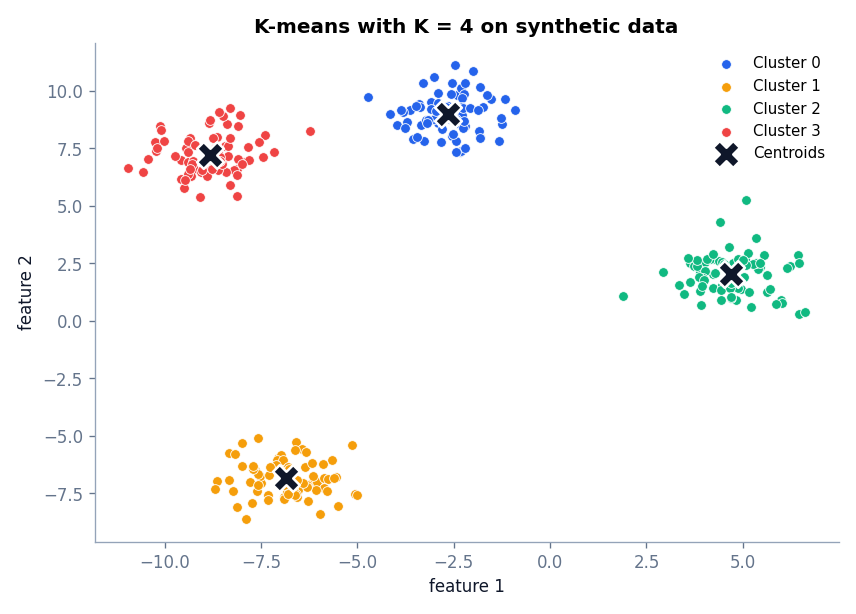
Cluster sizes: [75 75 75 75]
Inertia (WCSS): 409.2
Centroids:
[[-2.65  8.98]
 [-8.83  7.21]
 [-6.84 -6.84]
 [ 4.71  2.03]]
The loop converged in three iterations and produced four clusters of 75 points each. The inertia of 409.2 matches the value scikit-learn reports for the same data in the next section.
K-Means Clustering With scikit-learn
In practice you will use sklearn.cluster.KMeans. It is faster, uses a better initialization by default, and handles edge cases. The script below tries K from 2 to 10, records the inertia and silhouette score for each value, plots both, and then fits a final model.
import numpy as np
import matplotlib.pyplot as plt
from sklearn.cluster import KMeans
from sklearn.datasets import make_blobs
from sklearn.metrics import silhouette_score

X, _ = make_blobs(n_samples=300, centers=4, cluster_std=0.85, random_state=42)

ks = range(2, 11)
inertias, silhouettes = [], []
for k in ks:
    model = KMeans(n_clusters=k, n_init=10, random_state=42).fit(X)
    inertias.append(model.inertia_)
    silhouettes.append(silhouette_score(X, model.labels_))
    print(f"K={k:2d}  inertia={model.inertia_:8.1f}  silhouette={silhouettes[-1]:.3f}")

fig, axes = plt.subplots(1, 2, figsize=(11, 4))
axes[0].plot(list(ks), inertias, "o-")
axes[0].set(title="Elbow method", xlabel="K", ylabel="Inertia")
axes[1].plot(list(ks), silhouettes, "o-", color="green")
axes[1].set(title="Silhouette score", xlabel="K", ylabel="Mean silhouette")
plt.tight_layout()
plt.show()

# Fit the final model with the chosen K and use it on new points.
final = KMeans(n_clusters=4, n_init=10, random_state=42).fit(X)
print("\nFinal model cluster sizes:", np.bincount(final.labels_))
new_points = np.array([[0.0, 0.0], [5.0, 5.0]])
print("New points assigned to clusters:", final.predict(new_points))
K= 2 inertia= 9258.2 silhouette=0.600
K= 3 inertia= 1962.9 silhouette=0.773
K= 4 inertia= 409.2 silhouette=0.823
K= 5 inertia= 370.1 silhouette=0.715
K= 6 inertia= 332.6 silhouette=0.582
K= 7 inertia= 295.3 silhouette=0.444
K= 8 inertia= 262.9 silhouette=0.331
K= 9 inertia= 236.1 silhouette=0.344
K=10 inertia= 209.4 silhouette=0.364
Final model cluster sizes: [75 75 75 75]
New points assigned to clusters: [2 2]Key parameters of KMeans:
n_clusters: the number K.init: how to choose starting centroids. The default is"k-means++".n_init: how many times to run the algorithm from different starts. The model with the lowest inertia is kept.random_state: fixes the random seed so results are repeatable.
After fitting, labels_ holds the cluster of each training point, cluster_centers_ holds the centroids, inertia_ holds J, and predict() assigns new points to the nearest centroid.
Initialization Matters
Because K-means converges to a local optimum, poor starting centroids can produce poor clusters. For example, two starting centroids inside the same real group can split it in half while another real group gets merged with a neighbor.
K-means++ reduces this risk. It picks the first centroid at random, then chooses each new centroid with probability proportional to its squared distance from the nearest centroid already chosen. This spreads the starting centroids out. Combine it with several restarts through n_init and you will rarely see bad initialization problems on well-behaved data.
How to Choose K
K is the one parameter you must supply, and there is no perfect rule for choosing it. Two diagnostics are common.
The elbow method
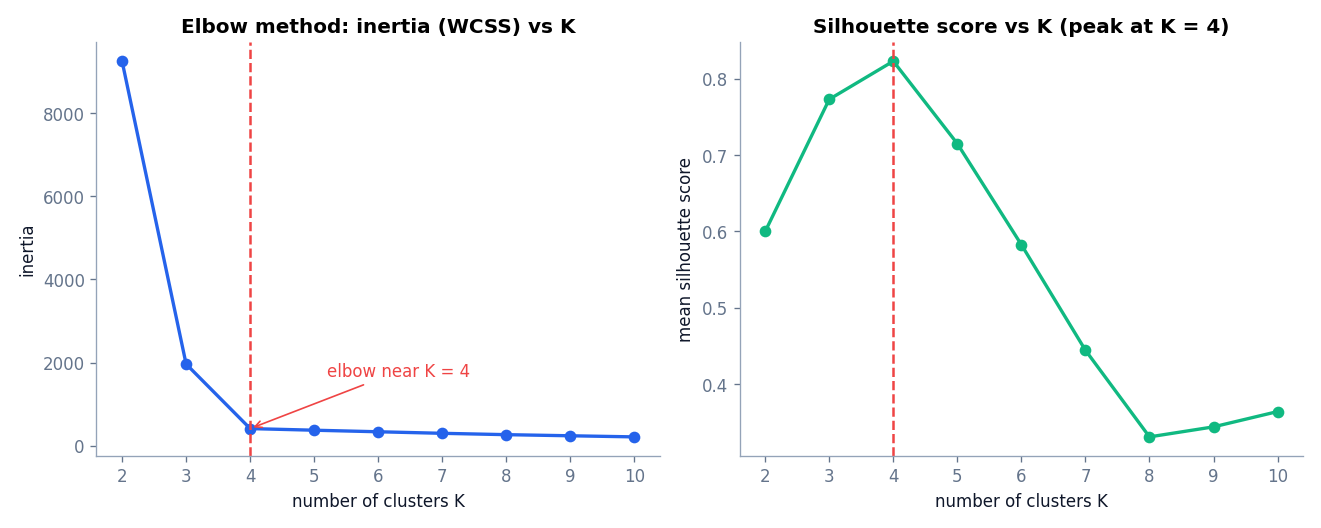
Inertia always falls as K grows, because more centroids mean shorter distances. Plot inertia against K and look for the point where the curve bends and the improvement per extra cluster drops sharply. In the output above, inertia falls from 9,258 at K = 2 to 1,963 at K = 3 and 409 at K = 4, then only to 370 at K = 5. The bend at K = 4 is the elbow.
The elbow is not always clear. Real data often produces a smooth curve with no obvious bend. In that case, rely on other evidence.
The silhouette score
The silhouette score measures how well each point fits its own cluster compared with the nearest other cluster. For one point, let a be the mean distance to the other points in its cluster and b the mean distance to the points in the nearest different cluster. Then
s = (b − a) / max(a, b)
The value ranges from −1 to 1. Values near 1 mean the point is well inside its cluster. Values near 0 mean it lies on a border. Negative values suggest it may be in the wrong cluster. The score for a clustering is the mean over all points. Here it peaks at 0.823 for K = 4, which agrees with the elbow.
Cautions about both methods
- Both are heuristics computed from the same features the algorithm used. They measure geometry, not business value.
- Silhouette scores favor compact, well-separated, round clusters, so they can prefer the wrong K when real clusters have other shapes.
- Use them to narrow the range, then inspect the candidate clusterings and choose the one you can interpret and use.
Preparing Data for K-Means
- Scale the features. K-means uses Euclidean distance, so a feature measured in thousands will dominate one measured in single digits. Standardize with
StandardScalerunless the features are already comparable. - Handle outliers. A single extreme point can drag a centroid away from its cluster. Investigate outliers, and consider removing them or transforming skewed features, for example with a logarithm.
- Use numeric features. K-means averages values, so it is a poor fit for raw categorical data. One-hot encoding helps a little, but other methods such as K-modes suit categories better.
- Reduce very high dimensions. If you have hundreds of features, apply PCA first so that distances remain meaningful.
- Do not leak labels. If your dataset contains a target column, leave it out of the features. If you use it afterward to inspect clusters, treat it as a reference only.
Limitations of K-Means
K-means is a strong baseline, but it makes assumptions that real data often breaks.
- You must choose K. The algorithm cannot discover the number of groups on its own.
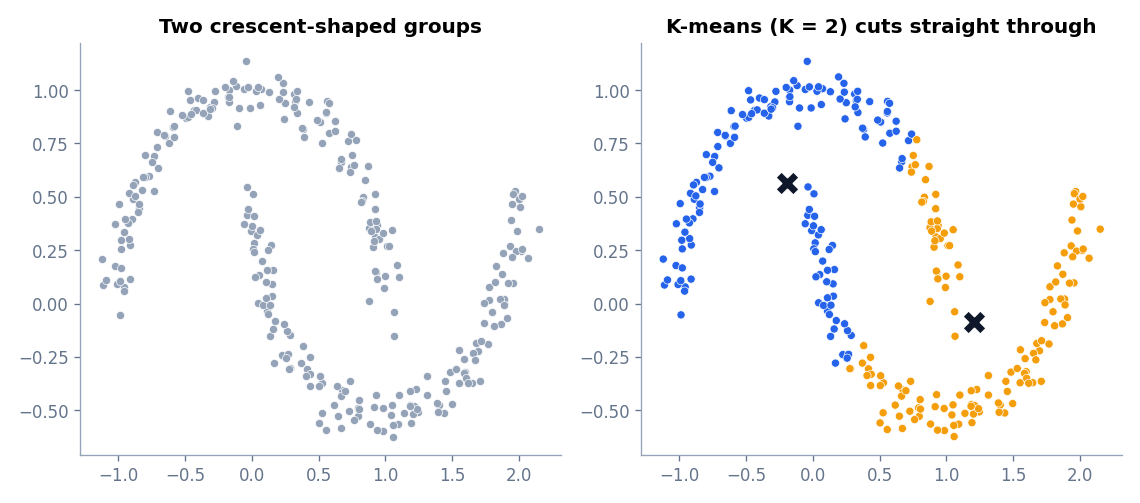
- It prefers round, similarly sized clusters. Boundaries between centroids are straight lines, so curved or elongated groups are cut apart, as the figure shows.
- It is sensitive to outliers. Centroids are means, and means move when extreme points are present.
- It gives hard assignments only. Every point belongs to exactly one cluster, even when it sits on a border. Gaussian Mixture Models provide soft membership probabilities.
- Results depend on initialization. Multiple restarts reduce this problem but do not remove it.
- Every point is assigned. There is no noise label, so outliers are forced into some cluster.
K-Means Compared With Other Clustering Methods
| Method | Needs K up front? | Cluster shapes | Handles noise? | Scales to large data? |
|---|---|---|---|---|
| K-means | Yes | Round, similar size | No | Very well |
| Hierarchical | No (cut the tree) | Depends on linkage | Limited | Poorly on very large data |
| DBSCAN | No | Arbitrary | Yes | Moderately |
| Gaussian mixture | Yes | Elliptical | No | Well |
Real-World Uses of K-Means
- Customer segmentation: grouping shoppers by spending and visit frequency. See the full walkthrough in Customer Segmentation with Python.
- Image color quantization: reducing an image to K representative colors.
- Document grouping: clustering text embeddings into topics.
- Initial data exploration: a quick way to see whether the data has obvious groups.
- Feature engineering: using cluster labels or distances to centroids as input features for a supervised model.
Common Mistakes
- Running K-means on unscaled features.
- Picking K by looking only at inertia, which always decreases.
- Believing the clusters are real categories because they have a tidy plot.
- Ignoring a single run’s randomness and reporting results without a fixed seed.
- Treating the silhouette score as proof instead of as one clue.
Frequently Asked Questions
Is K-means supervised or unsupervised?
Unsupervised. It uses only features and never sees labels.
What is the time complexity of K-means?
Each iteration costs roughly O(n · K · d) for n points, K clusters, and d features, so it scales linearly with the number of points. That is why it works on very large datasets.
Can K-means handle categorical data?
Not directly. The algorithm computes means, which are not defined for categories. Encode categories carefully or use a method designed for categorical data.
What does inertia mean?
Inertia is the sum of squared distances from each point to its assigned centroid. Lower values mean tighter clusters, but it always decreases as K increases.
How do I know if my K-means result is good?
Check the silhouette score, test stability across random seeds, plot the clusters, and examine each cluster’s average feature values. A good result is stable and can be described in plain language.
Conclusion
K-means alternates between two simple steps, assigning points to the nearest centroid and moving each centroid to the mean of its points, until nothing changes. It is fast, easy to implement, and a reliable first choice for compact, roughly round clusters. Its weaknesses are the need to choose K, sensitivity to scale and outliers, and difficulty with curved shapes.
When your data does not form tidy blobs, a method that builds a full tree of clusters may be more informative. Continue with Hierarchical Clustering Explained: Agglomerative Clustering and Dendrograms.
References
- scikit-learn documentation: K-means
- scikit-learn documentation: silhouette_score
- Arthur, D. and Vassilvitskii, S. (2007). k-means++: The Advantages of Careful Seeding. Proceedings of the ACM-SIAM Symposium on Discrete Algorithms.