
Overfitting vs Underfitting in Machine Learning
 Oct 23, 2026Published
9 min readReading time
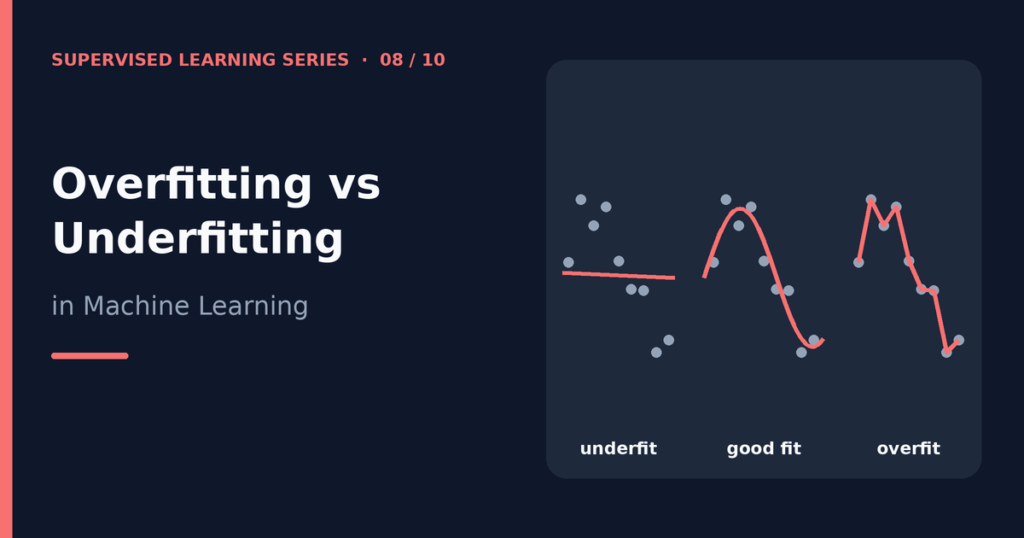
Overfitting vs underfitting describes the two most common ways a machine learning model fails to generalize. An overfit model learns the training data too closely, including its noise, so it scores well on training data but poorly on new data. An underfit model is too simple to capture the real pattern, so it scores poorly on both. A good model sits between the two.
This guide explains both problems in plain language, shows how model complexity and the bias-variance trade-off connect them, and lists practical fixes: regularization, cross-validation, early stopping, better data, and feature selection. A Python experiment with real numbers makes the ideas concrete.
Table of contents
Generalization: the real goal
A supervised model trains on past examples, but you want it to work on future ones. We call this ability generalization. Overfitting and underfitting are the two ways generalization breaks down. If you are new to the training process, read What Is Supervised Learning? first.
To measure generalization, you must test on data the model did not train on. That is why the series explains the split between training and test sets in Training Data vs Testing Data. Without that split, you cannot tell a model that learned from one that memorized.
What is overfitting?
Overfitting happens when a model fits the training data too well. It picks up random quirks and noise in the training set as if they were real patterns. A student who memorizes the answers to last year’s exam without understanding the subject behaves the same way. The student aces the old exam and fails a new one.
Typical signs of overfitting:
- Very high training score, much lower validation or test score.
- Performance that varies a lot when you change the training sample slightly.
- A very flexible model, such as a deep unpruned decision tree or a network with many parameters trained for a long time.
Common causes include a model that is too complex for the amount of data, too many features, noisy or mislabeled data, and training for too long.
What is underfitting?
Underfitting happens when a model is too simple to learn the real structure in the data. Fitting a straight line to data that follows a clear curve is a standard example. The model misses the pattern even on the training data.
Typical signs of underfitting:
- Poor scores on both the training set and the test set.
- Training and test scores that are close together, but both disappointing.
- A model with strong restrictions, such as a very shallow tree, heavy regularization, or too few features.
Common causes include a model with too little capacity, features that do not carry enough information, too much regularization, and training that stops too early.
How to tell them apart
Compare training performance with validation or test performance. The pattern tells you which problem you have.
| Situation | Training score | Validation or test score | Diagnosis |
|---|---|---|---|
| Both poor | Low | Low | Underfitting (high bias) |
| Large gap | High | Much lower | Overfitting (high variance) |
| Both good, small gap | High | Similarly high | Good fit |
A learning curve gives a deeper view. You train the model on increasing amounts of data and plot the training and validation scores. If both curves stay low and close together, more data will not help, and you need a more capable model. If the training curve stays high and a big gap remains, more data or a simpler model can help.
Model complexity
Complexity describes how flexible a model is. Examples:
- A decision tree becomes more complex as
max_depthgrows. - A polynomial model becomes more complex as its degree increases.
- A nearest-neighbor model becomes more complex as k gets smaller.
- A regularized model becomes less complex as its penalty grows stronger.
As complexity rises, training error keeps falling, because a flexible model can bend to fit any training point. Validation error first falls and then rises again once the model starts fitting noise. The best complexity lies near the lowest point of the validation error curve. The experiment later in this article shows the pattern with a decision tree.
The bias-variance trade-off
Statisticians explain overfitting and underfitting with two kinds of error:
- Bias is error from wrong or overly simple assumptions. A high-bias model misses real patterns, and it underfits.
- Variance is error from sensitivity to the particular training sample. A high-variance model changes a lot when the training data changes, and it overfits.
For squared-error problems, the expected prediction error splits into three parts:
Expected error = bias² + variance + irreducible noise
The irreducible noise comes from randomness in the data that no model can predict. You can reduce bias by using a more flexible model, but that tends to raise variance. You can reduce variance by simplifying the model, but that tends to raise bias. This tension is the bias-variance trade-off. Your goal is to find a balance that minimizes total error on new data, not to drive either term to zero.
Ensembles show one smart way to ease the trade-off. A random forest averages many high-variance trees to cut variance without adding much bias. See Random Forest vs Decision Tree for details.
How to reduce overfitting
Collect more and better data
More training examples make it harder for a model to memorize noise. Clean labels matter just as much, because a model will faithfully learn labeling mistakes.
Simplify the model
Reduce depth, remove layers, use fewer parameters, or choose a simpler algorithm. For trees, limits such as max_depth and min_samples_leaf, or cost-complexity pruning, control growth. The decision tree algorithm article covers these settings.
Use regularization
Regularization adds a penalty for complexity, usually for large coefficients. Ridge (L2) and lasso (L1) regularization do this for linear models. In logistic regression, the parameter C controls the strength, and smaller values mean stronger regularization. Neural networks use related tools such as weight decay and dropout.
Use cross-validation
Cross-validation gives a more reliable estimate of generalization than one split, and it helps you choose settings that do not overfit a single validation set. The article on training and testing data explains how it works.
Apply early stopping
For models trained in steps, such as gradient boosting or neural networks, watch the validation score as training proceeds. Stop when it stops improving, even if the training score keeps getting better. Early stopping prevents the model from drifting into memorization.
Select features carefully
Remove features that add noise or duplicate other features. Fewer, more informative features reduce the room for overfitting. Perform feature selection inside the cross-validation loop, or you will leak information from the validation data.
Try ensembles
Bagging and random forests reduce variance by averaging many models.
How to reduce underfitting
- Use a more flexible model. Move from a straight line to a polynomial, or from a shallow tree to a deeper one.
- Add informative features. Create features that expose the pattern, such as ratios, interactions, or transformed variables.
- Reduce regularization. If the penalty is too strong, the model cannot learn the pattern.
- Train longer. Models trained iteratively may need more steps.
- Check the data. If the features simply carry no signal about the target, no model can fix that. Return to data collection.
Python experiment
The experiment trains decision trees of increasing depth on the breast cancer dataset and prints training and test accuracy for each depth. Higher depth means a more complex model. The split is stratified, with 30% of the data held out for testing.
from sklearn.datasets import load_breast_cancer
from sklearn.model_selection import train_test_split
from sklearn.tree import DecisionTreeClassifier

X, y = load_breast_cancer(return_X_y=True)
X_train, X_test, y_train, y_test = train_test_split(
    X, y, test_size=0.3, stratify=y, random_state=0)

print("depth | train acc | test acc")
for d in [1, 2, 3, 5, 8, None]:
    m = DecisionTreeClassifier(max_depth=d, random_state=0).fit(X_train, y_train)
    print(f"{str(d):>5} | {m.score(X_train, y_train):.3f}     | {m.score(X_test, y_test):.3f}")
When I ran this with Python 3.12 and scikit-learn 1.8.0, the output was:
depth | train acc | test acc
    1 | 0.932     | 0.889
    2 | 0.942     | 0.906
    3 | 0.980     | 0.901
    5 | 0.997     | 0.912
    8 | 1.000     | 0.906
 None | 1.000     | 0.906
Here is what the numbers show:
- Training accuracy climbs steadily from 0.932 to a perfect 1.000 as the tree grows deeper. A more flexible model can always fit the training data better.
- Test accuracy barely moves. It stays between about 0.889 and 0.912 for every depth.
- The gap between training and test accuracy grows from about 0.04 at depth 1 to about 0.09 at depth 8 and beyond. A growing gap is the standard signature of overfitting.
- Depth 1 shows mild underfitting, because it has the lowest scores on both sets.
Be careful not to overread this table. The test set holds 171 rows, so a single row changes accuracy by about 0.006, and the differences between depths 2 and 8 are within that kind of noise. The effect on this dataset is also modest, because the breast cancer data is fairly easy. On noisier data, the overfitting penalty is often much larger. For a real decision about depth, use cross-validation instead of one test split.
Frequently asked questions
What is the difference between overfitting and underfitting?
Overfitting means the model learns the training data too closely and fails on new data. Underfitting means the model is too simple to learn the pattern and performs poorly even on training data.
How do I know if my model is overfitting?
Compare the training score with the validation or test score. A high training score paired with a much lower validation score signals overfitting. Learning curves and cross-validation make the diagnosis more reliable.
Is overfitting worse than underfitting?
Neither is better. Both produce models that fail on new data. Overfitting is easier to miss, because the training score looks excellent, so many beginners fall into it more often.
Can more data fix overfitting?
Often it helps, because it becomes harder to memorize noise. It will not help underfitting if the model itself is too simple, and it will not help if new data contains the same label errors.
What is the bias-variance trade-off in one sentence?
Making a model more flexible lowers its bias but raises its variance, so you must balance the two to minimize error on new data.
Does regularization always prevent overfitting?
It reduces the risk, but too much regularization causes underfitting. Tune the strength with cross-validation.
Conclusion
Overfitting and underfitting are two sides of the same challenge: finding the right model complexity. Underfit models are too simple and show poor scores everywhere. Overfit models are too flexible and show a large gap between training and test performance. You can manage both with the right amount of data, sensible complexity, regularization, cross-validation, early stopping, and clean features.
To judge whether a model generalizes, you need the right metrics. Continue with How to Evaluate a Supervised Learning Model.
This article is for educational and informational purposes only. Examples and code are provided to help readers understand overfitting and underfitting and may require adaptation for specific projects.
Related guides
To avoid misleading evaluation results, review Training Data vs Testing Data and learn practical evaluation methods in How to Evaluate a Supervised Learning Model.
References and further reading
- Validation curves and learning curves (scikit-learn user guide) for tools that diagnose both problems.
- Overfitting vs. underfitting (IBM) for another explanation of the balance.