
Classification vs Regression in Machine Learning
 Oct 23, 2026Published
9 min readReading time
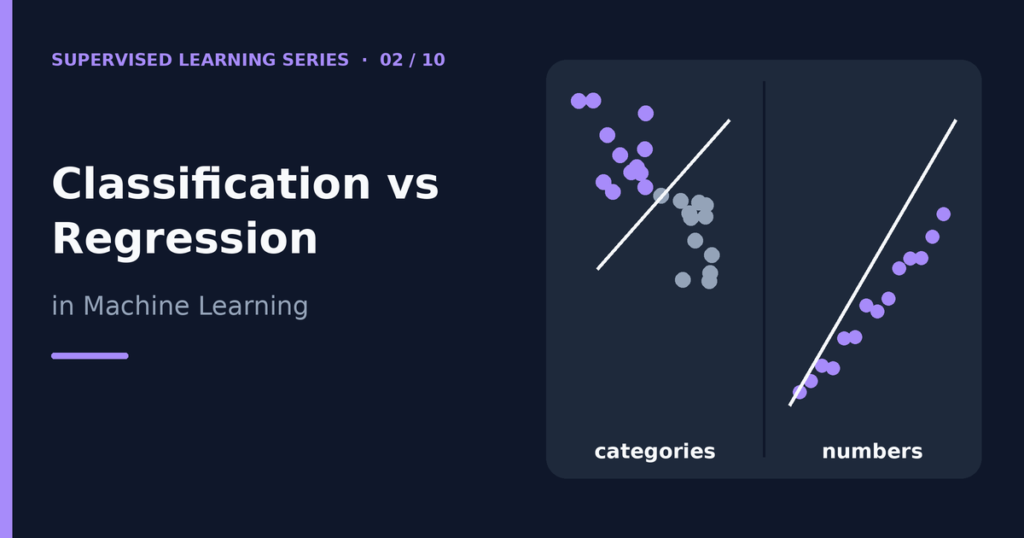
The difference between classification vs regression comes down to the answer you want. Classification predicts a category, such as “spam” or “not spam.” Regression predicts a number on a continuous scale, such as a house price or tomorrow’s temperature. Both belong to supervised learning, so both learn from labeled examples.
This guide explains how the two tasks differ, which algorithms and metrics fit each one, and how to decide which task your own problem needs. If you are new to the field, read What Is Supervised Learning? first.
Table of contents
Classification vs regression at a glance
The table below summarizes the main differences. The rows give you a quick reference, and the sections after it explain each point.
| Aspect | Classification | Regression |
|---|---|---|
| Goal | Assign an example to a class | Predict a numeric quantity |
| Output type | Discrete labels (for example “cat,” “dog”) | Continuous numbers (for example 245.7) |
| Typical question | “Which one?” or “Yes or no?” | “How much?” or “How many?” |
| Example | Will this customer cancel? (yes/no) | How much will this customer spend? |
| Common algorithms | Logistic regression, decision tree classifier, k-nearest neighbors | Linear regression, decision tree regressor, random forest regressor |
| Common metrics | Accuracy, precision, recall, F1-score, ROC-AUC | MAE, MSE, RMSE, R-squared |
| Typical diagnostic | Confusion matrix | Predicted-versus-actual plot, residual plot |
One rule sits behind every row: the target variable decides the task, not the algorithm. If the target is a category, you have a classification problem. If the target is a measurable number, you have a regression problem.
What is classification?
Classification models learn to place each example into one of several predefined classes. The model looks at the features, such as the words in an email, and outputs a class label.
Binary classification
Binary classification has exactly two classes. Examples include spam versus not spam, fraud versus legitimate, and disease present versus absent. By convention, programmers often call one class “positive” and the other “negative.” The positive class is usually the one you care most about finding.
Multiclass classification
Multiclass classification has three or more classes, and each example belongs to exactly one. Recognizing handwritten digits from 0 to 9 and sorting news stories into sports, politics, or business are typical cases.
Multilabel classification
In multilabel classification, one example can have several labels at once. A photo might be tagged “beach,” “sunset,” and “people” together. Many beginners overlook this type, but it appears often in tagging systems.
Many classifiers can output probabilities, for example “82% likely to be spam,” and then convert the probability into a class using a threshold. This detail causes a lot of confusion, because a probability is a number. The model is still a classifier, since its final job is to choose a class.
What is regression?
Regression models predict a numeric value. The target can take any value in a range, and nearby values mean similar things: a price of 200,000 is close to 201,000. The model outputs one number for each example.
Typical regression tasks include predicting house prices, estimating how many minutes a delivery will take, forecasting energy use, and predicting a patient’s blood pressure from other measurements. A regression model rarely hits the exact true value, so we judge it by how far off its predictions are on average.
The simplest version, simple linear regression, fits a straight line through the data. You can study it in detail in Linear Regression Explained with Examples.
Common algorithms for each task
Many algorithms come in two versions: one for classification and one for regression. The core idea stays the same, but the final output and the loss function differ.
| Algorithm family | Classification version | Regression version |
|---|---|---|
| Linear models | Logistic regression | Linear regression, ridge, lasso |
| Decision trees | DecisionTreeClassifier |
DecisionTreeRegressor |
| Random forests | RandomForestClassifier |
RandomForestRegressor |
| Nearest neighbors | KNeighborsClassifier |
KNeighborsRegressor |
| Support vector machines | SVC |
SVR |
Logistic regression deserves a special note. Despite its name, it is a classification algorithm. It uses a regression-style equation internally, then converts the result into a probability and a class. The article on logistic regression explains how this works.
Decision trees show the “two versions” idea clearly. A classification tree ends each branch with a class label. A regression tree ends each branch with an average of the numbers that landed there. You can explore the method in Decision Trees in Machine Learning: How They Work.
Evaluation metrics for each task
You cannot use the same score for both tasks. Accuracy means nothing when the target is a price, and average error means nothing when the target is a class.
Classification metrics
- Accuracy: the share of predictions that are correct.
- Precision: among examples predicted positive, the share that really are positive.
- Recall: among truly positive examples, the share the model found.
- F1-score: a single number that balances precision and recall.
- ROC-AUC: how well the model ranks positives above negatives across all thresholds.
Regression metrics
- MAE (mean absolute error): the average size of the errors, in the units of the target.
- MSE (mean squared error): the average of squared errors, which punishes large mistakes more.
- RMSE (root mean squared error): the square root of MSE, back in the units of the target.
- R-squared: the share of the target’s variation that the model explains.
Each metric has traps. For example, accuracy can look excellent on a dataset where 95% of examples belong to one class. The full discussion lives in How to Evaluate a Supervised Learning Model.
How to choose the right task
Use these questions to decide. Work through them in order.
Step 1: Look at the target
Ask what the answer looks like. If it is a label from a list, choose classification. If it is a quantity that can take many values, choose regression.
Step 2: Think about what the decision needs
Sometimes the same business question can be framed both ways. A store might want to know “How many units will we sell next week?” (regression) or “Will we sell out? Yes or no?” (classification). Pick the framing that matches the action you will take. If you must order a specific quantity, you need the number. If you only need a warning flag, a yes-or-no answer may be enough.
Step 3: Handle in-between cases carefully
- Ordered categories. Ratings from 1 to 5 stars have an order. You can treat them as five classes, as a numeric target, or use a special method called ordinal regression that respects the order.
- Counts. The number of customer visits is a whole number, but it behaves like a quantity, so regression methods usually fit better.
- Binned numbers. You can turn a number into classes, for example “low,” “medium,” and “high” price. This simplifies the task but throws away detail. Do it only when the decision really uses the bins.
Step 4: Check your data
Make sure the target column is stored the way you intend. Class labels that appear as numbers (0, 1, 2) can trick a beginner into running regression on what is really a category.
A side-by-side Python example
The code below trains one classifier and one regressor with scikit-learn. The classifier predicts the iris flower species. The regressor predicts a diabetes progression score from medical measurements. Both use a decision tree with limited depth, and both split the data before training.
from sklearn.datasets import load_iris, load_diabetes
from sklearn.model_selection import train_test_split
from sklearn.tree import DecisionTreeClassifier, DecisionTreeRegressor
from sklearn.metrics import accuracy_score, mean_absolute_error

# Classification: predict a species (a category)
X, y = load_iris(return_X_y=True)
X_tr, X_te, y_tr, y_te = train_test_split(X, y, test_size=0.2, stratify=y, random_state=42)
clf = DecisionTreeClassifier(max_depth=3, random_state=42).fit(X_tr, y_tr)
print("Classification accuracy:", round(accuracy_score(y_te, clf.predict(X_te)), 3))

# Regression: predict a progression score (a number)
X, y = load_diabetes(return_X_y=True)
X_tr, X_te, y_tr, y_te = train_test_split(X, y, test_size=0.2, random_state=42)
reg = DecisionTreeRegressor(max_depth=3, random_state=42).fit(X_tr, y_tr)
print("Regression MAE:", round(mean_absolute_error(y_te, reg.predict(X_te)), 1))
When I ran this code with Python 3.12 and scikit-learn 1.8.0, it printed:
Classification accuracy: 0.967
Regression MAE: 48.1
The two numbers are not comparable, and that is the point. An accuracy of 0.967 means the classifier got about 97% of the test flowers right. An MAE of 48.1 means the regressor’s predictions missed the true score by about 48 points on average, in the units of the target. Whether 48 is good depends on the scale of the scores, which range roughly from 25 to 346 in this dataset.
Common mistakes
- Choosing the algorithm before the task. Decide whether the target is a category or a number first. The algorithm comes second.
- Using accuracy on imbalanced classes. A model that always predicts the majority class can score high accuracy while being useless.
- Rounding regression output to fake a classification. If you need a class, train a classifier. Rounding predictions from a model trained for numbers usually performs worse.
- Treating category codes as numbers. A regression model will assume that class 2 is “twice” class 1, which is rarely true.
- Comparing metrics across tasks. Accuracy and MAE measure different things, so never compare them directly.
Frequently asked questions
Is logistic regression a regression or a classification algorithm?
It is a classification algorithm. The name comes from its mathematical roots in regression, but its output is a class probability that you turn into a class label.
Can one algorithm do both classification and regression?
Yes. Decision trees, random forests, k-nearest neighbors, and neural networks all have versions for both tasks. Some algorithms, such as logistic regression, focus on one task.
How do I know whether my problem is classification or regression?
Look at the target column. A label from a fixed list means classification. A number with a meaningful scale means regression. When the target could be framed either way, choose the version that matches the decision you need to make.
Which is harder, classification or regression?
Neither is harder in general. Difficulty depends on the data, the noise in the target, and how much predictive signal the features contain. Each task has its own pitfalls, such as class imbalance in classification and outliers in regression.
Can I convert a regression problem into classification?
You can, by grouping the numeric target into bins such as “low,” “medium,” and “high.” You lose detail when you do this, so only convert when the decision truly depends on the groups.
Conclusion
Classification and regression solve different problems. Classification answers “which category?” and regression answers “how much?” The target variable tells you which one you need, and that choice shapes your algorithm, your metrics, and your diagnostics.
Once you can recognize the task, you are ready to prepare your data fairly. Continue with Training Data vs Testing Data: What Is the Difference? to learn how to split your examples without fooling yourself.
This article is for educational and informational purposes only. Examples and code are provided to help readers understand the difference between classification and regression and may require adaptation for specific projects.
Related guides
Explore the two main approaches in more detail: Linear Regression Explained with Examples and Logistic Regression Explained for Beginners.
References and further reading
- Decision Trees in the scikit-learn user guide for both classifier and regressor versions.
- Metrics and scoring in the scikit-learn user guide for classification and regression metrics.
- Classification versus regression (IBM) for another overview of the two tasks.