
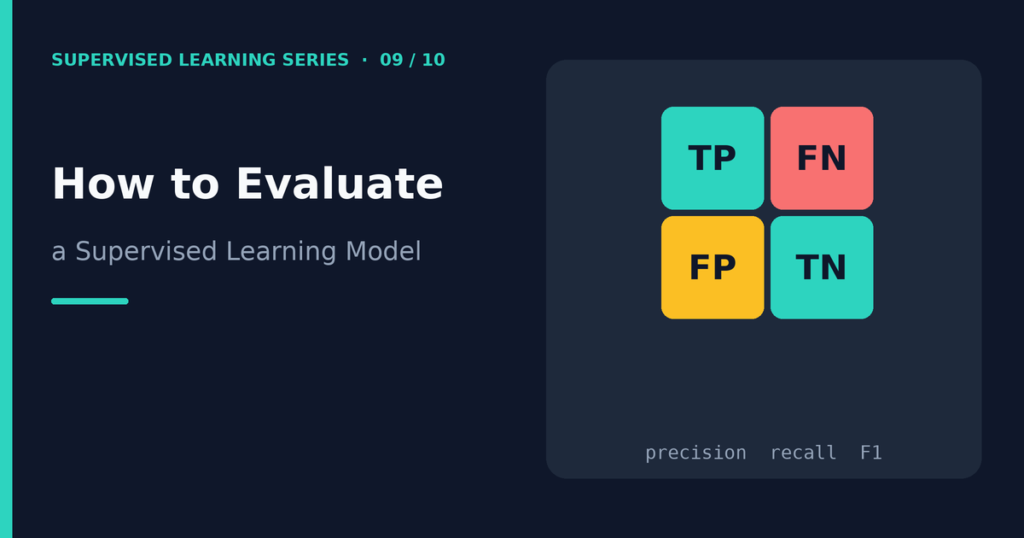
How to Evaluate a Supervised Learning Model
Supervised learning model evaluation means measuring how well a trained model predicts the correct answers on data it has not seen. You compare the model’s predictions with the true labels and summarize the difference with a metric. For classification you might use accuracy, precision, recall, F1-score, or ROC-AUC. For regression you might use MAE, MSE, RMSE, or R-squared. The right metric depends on your task and on which mistakes cost you the most. This guide explains each metric with formulas and examples, shows how a confusion matrix works, warns about class imbalance, and helps you choose a metric and a decision threshold. A Python example prints real results. If the word “classification” or “regression” is new to you, see Classification vs Regression in Machine Learning first. Table of contents Why evaluation matters The confusion matrix Classification metrics Class imbalance ROC curve and ROC-AUC Threshold selection Regression metrics How to choose a metric Python example Frequently asked questions Conclusion Why evaluation matters A model that cannot be measured cannot be trusted. Evaluation tells you whether a model is good enough to use, which of several models to choose, and where the model fails. It also catches problems such as overfitting, which you can study in Overfitting vs Underfitting in Machine Learning. Two rules keep evaluation honest. First, always measure on data the model has not trained on, such as a validation set, cross-validation folds, or a final test set. The article on training data vs testing data explains how. Second, pick your metric before you start comparing models, so that you do not choose the metric that happens to flatter your favorite model. The confusion matrix Most classification metrics come from a confusion matrix, a table that counts how often the model’s predictions match the truth. For a binary problem, we call one class “positive” (usually the class you want to find) and the other “negative.” The matrix has four cells: Predicted positive Predicted negative Actually positive True positives (TP) False negatives (FN) Actually negative False positives (FP) True negatives (TN) True positive: the model said positive, and it was right. True negative: the model said negative, and it was right. False positive: the model said positive, but the example was negative (a false alarm). False negative: the model said negative, but the example was positive (a miss). Note that scikit-learn’s confusion_matrix function puts the true classes in rows and the predicted classes in columns, and it orders them by class label. With labels 0 and 1, the layout is [[TN, FP], [FN, TP]]. Always check which class counts as positive in your project. Classification metrics Accuracy Accuracy is the share of all predictions that are correct: Accuracy = (TP + TN) / (TP + TN + FP + FN) It is simple and easy to explain, but it can mislead you when classes are imbalanced. Precision Precision asks: “Of everything the model called positive, how much really was positive?” Precision = TP / (TP + FP) High precision means few false alarms. Precision matters when false positives are costly, such as flagging a legitimate email as spam. Recall Recall (also called sensitivity or the true positive rate) asks: “Of all the truly positive examples, how many did the model find?” Recall = TP / (TP + FN) High recall means few misses. Recall matters when false negatives are costly, such as missing a fraudulent transaction or a patient who needs follow-up tests. F1-score Precision and recall often pull in opposite directions. The F1-score combines them using the harmonic mean: F1 = 2 × (Precision × Recall) / (Precision + Recall) The harmonic mean punishes imbalance between the two. A model with precision 1.0 and recall 0.1 gets an F1 of only about 0.18. Use F1 when you care about both kinds of error and want one number. Specificity Specificity is the recall of the negative class: TN / (TN + FP). It tells you how well the model recognizes negatives. Class imbalance Class imbalance means one class is much rarer than the other. Fraud, rare diseases, and equipment failures all produce imbalanced data. In these cases, accuracy can look wonderful while the model is useless. Consider 100 transactions, of which 5 are fraud. A “model” that always predicts “not fraud” gets 95 out of 100 right. Its accuracy is 95%, yet it finds none of the fraud. Its recall for fraud is zero. I verified this with a short script: always predicting the majority class gives an accuracy of 0.95 and a recall of 0.0 on that example. For imbalanced problems, look at precision, recall, and F1 for the rare class, and examine the confusion matrix directly. The precision-recall curve and its area (PR-AUC) are often more informative than ROC-AUC when positives are rare. Some practitioners also use class weights during training or resampling. If you resample, do it only on the training data, never on the test data. ROC curve and ROC-AUC Many classifiers output a probability or a score, and you convert it to a class using a threshold. The ROC curve (receiver operating characteristic) shows how the model performs across all possible thresholds. It plots the true positive rate (recall) against the false positive rate (FP / (FP + TN)). The AUC (area under the curve) compresses the curve into one number between 0 and 1. A value of 0.5 means the model ranks examples no better than chance. A value of 1.0 means it ranks every positive example above every negative one. A useful reading is this: ROC-AUC equals the probability that the model gives a randomly chosen positive example a higher score than a randomly chosen negative example. ROC-AUC does not depend on a threshold, which makes it handy for comparing models. It does not tell you which threshold to use, and it can look overly optimistic on heavily imbalanced data. Threshold selection The default threshold of 0.5 is only a convention. Moving it changes the balance between precision and recall: Lower threshold: the