
gradient descent

linear regression
Artificial Intelligence, Featured Articles

Linear Regression Explained with Examples

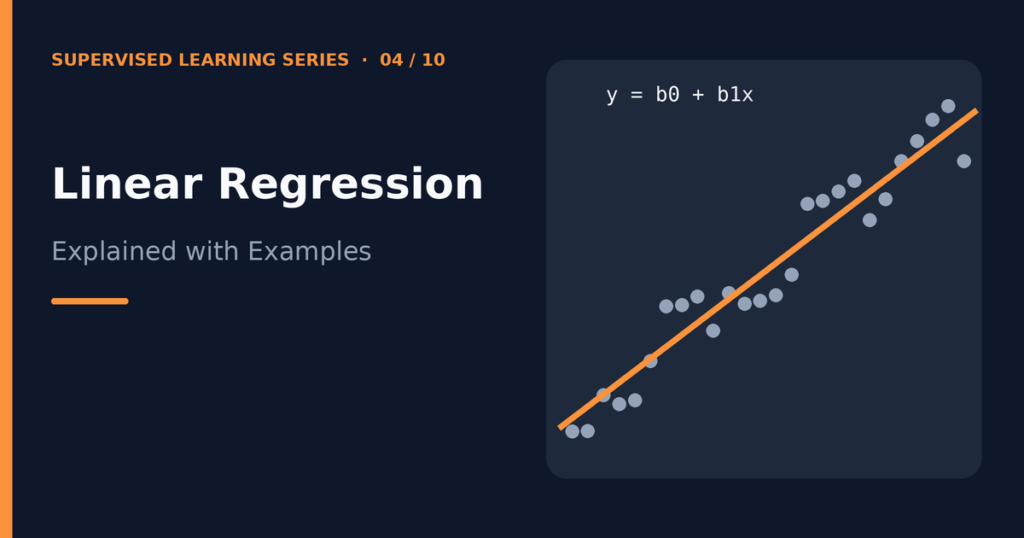
Linear regression is a supervised learning method that predicts a number by fitting a straight line (or, with several features, a flat plane) through your data. It finds the line that keeps the prediction errors as small as possible. Because the method is simple, fast, and easy to interpret, it is the standard first algorithm for anyone learning machine learning. This guide explains linear regression with examples. You will see the equation, learn what coefficients and the intercept mean, work through a tiny least squares calculation by hand, understand gradient descent, and run a complete Python example. If you want background on the task type first, read Classification vs Regression in Machine Learning. Table of contents The core idea The linear regression equation Loss function and the best-fit line Least squares: a worked example Gradient descent Assumptions of linear regression Evaluation metrics Working Python example Limitations Frequently asked questions Conclusion The core idea Suppose you want to predict a house’s price from its size. You plot many past sales, with size on the horizontal axis and price on the vertical axis. The points rise from left to right but do not sit on a perfect line. Linear regression draws the one straight line that passes as close as possible to all the points. To predict a new house, you find its size on the line and read off the price. With one feature, this is simple linear regression. With several features, such as size, bedrooms, and age, it is multiple linear regression. The idea stays the same: the prediction is a weighted sum of the features plus a starting value. The linear regression equation For one feature, the model is: ŷ = β₀ + β₁x Here is what each symbol means: ŷ (read “y-hat”) is the predicted value of the target. x is the feature, for example the house size. β₁ is the coefficient (also called the slope or weight). It tells you how much the prediction changes when x increases by one unit. β₀ is the intercept. It is the prediction when x equals zero. For several features, you add one coefficient per feature: ŷ = β₀ + β₁x₁ + β₂x₂ + … + βₚxₚ Each coefficient describes the effect of its feature while the other features stay fixed. If β₁ equals 1.5 for house size in square meters, then each extra square meter adds 1.5 units to the predicted price, assuming the other features do not change. Be careful with the word “effect.” The model describes an association in the data. It does not prove that changing the feature would cause the target to change. The intercept sometimes has no practical meaning. A house of zero square meters does not exist, so the intercept simply positions the line. Loss function and the best-fit line Infinitely many lines pass through a cloud of points. To choose the best one, we need a way to score each line. That score is the loss function, and linear regression usually uses the sum or mean of squared errors. For each training example, the residual is the difference between the true value and the predicted value: residual = y − ŷ. Squaring the residuals makes every error positive, so errors above and below the line cannot cancel each other out. Squaring also punishes large errors more than small ones. The mean squared error is: MSE = (1/n) × Σ (yᵢ − ŷᵢ)² Here n is the number of examples, and Σ means “add up over all examples.” The best-fit line is the one with the smallest MSE. This approach is called ordinary least squares (OLS). Least squares: a worked example You can find the best line with a short calculation. Take three points: (1, 2), (2, 4), and (3, 5), where the first number is x and the second is y. Compute the means: x̄ = 2 and ȳ = 11/3 ≈ 3.667. Compute the slope with β₁ = Σ(x − x̄)(y − ȳ) / Σ(x − x̄)². The numerator is (−1)(−1.667) + (0)(0.333) + (1)(1.333) = 3. The denominator is 1 + 0 + 1 = 2. So β₁ = 1.5. Compute the intercept with β₀ = ȳ − β₁x̄ = 3.667 − 1.5 × 2 ≈ 0.667. The fitted line is ŷ = 0.667 + 1.5x. Its predictions for the three points are about 2.167, 3.667, and 5.167. The residuals are about −0.167, 0.333, and −0.167, and the sum of their squares is about 0.167. No other straight line gives a smaller sum for these three points. For large datasets and many features, software solves the same problem with matrix algebra. Scikit-learn’s LinearRegression does exactly that, so you rarely calculate it yourself. Gradient descent The least squares formula gives the answer in one step for linear regression. However, many other models have no such formula, so machine learning often uses gradient descent, an iterative method. Linear regression is the classic way to learn it. Picture the loss as a hilly landscape, where each position is a pair of values (β₀, β₁) and the height is the MSE. You start at a random position and take small steps downhill until you reach the bottom. At each step, you: Calculate the gradient, which points in the direction where the loss grows fastest. Move each parameter a small step in the opposite direction. The update rule is β ← β − α × (gradient). The symbol α is the learning rate, which controls the step size. If α is too small, training is slow. If α is too large, the steps overshoot and the loss may grow instead of shrink. For linear regression with squared error, the loss surface is bowl-shaped, so gradient descent heads toward a single global minimum rather than getting stuck in local dips. Gradient descent matters most for huge datasets, where a direct solution is slow, and for models with no direct solution. In scikit-learn, the SGDRegressor class uses a stochastic version. Features should be scaled before using it
Multilayer perceptron
Deep Learning, Featured Articles

Multilayer Perceptron (MLP): Architecture, Formula, Working, Examples, and Applications

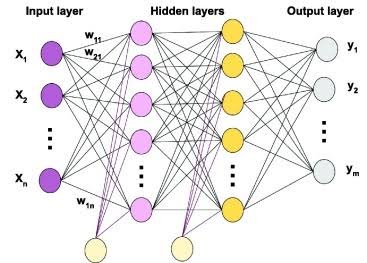
A Multilayer Perceptron (MLP) is one of the fundamental architectures in artificial neural networks and deep learning. It uses multiple layers of interconnected neurons to learn patterns from data and make predictions. A basic perceptron can only solve linearly separable problems. A multilayer perceptron overcomes this limitation by adding hidden layers and non-linear activation functions. As a result, an MLP can learn much more complex relationships. MLPs form an important foundation for understanding neural networks. Concepts such as weights, biases, activation functions, forward propagation, loss functions, backpropagation, and gradient-based optimization all play a central role in how they work. This guide explains what a multilayer perceptron is, how its architecture works, the formulas behind it, why non-linearity matters, how an MLP solves the XOR problem, how to calculate its parameters, and how to build one in Python. What Is a Multilayer Perceptron? A Multilayer Perceptron (MLP) is a type of feedforward artificial neural network that contains an input layer, one or more hidden layers, and an output layer. The network receives input data, transforms that data through its hidden layers, and produces a prediction through its output layer. A typical MLP follows this structure: Input Layer → Hidden Layer(s) → Output Layer Each neuron receives information from the previous layer, applies weights and biases, performs a mathematical calculation, and passes the result through an activation function. During training, the MLP adjusts its weights and biases to reduce prediction errors. MLPs can perform both: Classification Regression For example, an MLP can classify whether an email is spam or predict the price of a house. Multilayer Perceptron Architecture A standard multilayer perceptron contains three main types of layers. Input Layer The input layer receives the original data. Each input neuron usually represents one feature. For example, a model that predicts student performance might receive: Hours studied Attendance percentage Previous exam score Number of completed assignments If the dataset contains four input features, the input layer usually receives four input values. The input layer does not perform the main learning process. Instead, it passes the feature values to the first hidden layer. Hidden Layers Hidden layers perform most of the transformations inside an MLP. Each neuron receives outputs from the previous layer, calculates a weighted sum, adds a bias, and applies an activation function. An MLP can contain: One hidden layer Several hidden layers Adding hidden layers allows the network to build increasingly complex representations of the input data. For example, an early hidden layer may learn simple relationships, while later layers can combine those relationships into more complex patterns. Output Layer The output layer produces the final prediction. The number of output neurons and the activation function depend on the problem. For example: A regression problem may use one output neuron. A binary classification problem often uses one output neuron with a sigmoid function. A multi-class classification problem often uses multiple output neurons with softmax. Are MLP Layers Fully Connected? Yes. A standard multilayer perceptron uses fully connected layers, also called dense layers. In a fully connected layer, every neuron in one layer connects to every neuron in the next layer. For example, if an input layer contains four neurons and the next hidden layer contains six neurons, every one of the four inputs connects to all six hidden neurons. These connections contain learnable weights. This fully connected structure gives an MLP its ability to combine information from multiple input features. However, it can also create a large number of parameters as the network grows. Multilayer Perceptron Formula The mathematical foundation of an MLP begins with the calculation performed by a single neuron. A neuron calculates a weighted sum: [ z = w_1x_1 + w_2x_2 + \dots + w_nx_n + b ] The neuron then applies an activation function: [ a = f(z) ] Where: (x_1, x_2, \dots, x_n) are the input values (w_1, w_2, \dots, w_n) are the weights (b) is the bias (z) is the weighted input (f) is the activation function (a) is the output of the neuron An MLP performs this calculation across many neurons and layers. General Multilayer Perceptron Formula For any layer (l), an MLP calculates the weighted input as: \mathbf{W}^{(l)} \mathbf{A}^{(l-1)} + \mathbf{b}^{(l)} ] The layer then applies an activation function: f\left( \mathbf{Z}^{(l)} \right) ] Combining both steps gives the general MLP formula: f\left( \mathbf{W}^{(l)} \mathbf{A}^{(l-1)} + \mathbf{b}^{(l)} \right) ] Where: (\mathbf{A}^{(l-1)}) is the output from the previous layer (\mathbf{W}^{(l)}) is the weight matrix (\mathbf{b}^{(l)}) is the bias vector (\mathbf{Z}^{(l)}) is the weighted input (f) is the activation function (\mathbf{A}^{(l)}) is the output of the current layer The output from one layer becomes the input to the next layer. MLP Formula for Multiple Layers Consider an MLP with an input layer, two hidden layers, and an output layer. The original input is: [ \mathbf{A}^{(0)} = \mathbf{X} ] First Hidden Layer The first hidden layer calculates: \mathbf{W}^{(1)} \mathbf{X} + \mathbf{b}^{(1)} ] It then applies an activation function: f_1 \left( \mathbf{W}^{(1)} \mathbf{X} + \mathbf{b}^{(1)} \right) ] Second Hidden Layer The second hidden layer receives the output from the first hidden layer: \mathbf{W}^{(2)} \mathbf{A}^{(1)} + \mathbf{b}^{(2)} ] Its output becomes: f_2 \left( \mathbf{W}^{(2)} \mathbf{A}^{(1)} + \mathbf{b}^{(2)} \right) ] Output Layer The output layer receives the final hidden representation: \mathbf{W}^{(L)} \mathbf{A}^{(L-1)} + \mathbf{b}^{(L)} ] The network then produces the prediction: f_L \left( \mathbf{W}^{(L)} \mathbf{A}^{(L-1)} + \mathbf{b}^{(L)} \right) ] Here, (\hat{\mathbf{Y}}) represents the predicted output. Understanding Matrix Dimensions in an MLP Understanding matrix dimensions helps explain how an MLP processes multiple inputs and neurons efficiently. Suppose: The input contains (n) features. The first hidden layer contains (h) neurons. The input vector can have the shape: [ \mathbf{X} \in \mathbb{R}^{n} ] The weight matrix can have the shape: [ \mathbf{W}^{(1)} \in \mathbb{R}^{h \times n} ] The bias vector can have the shape: [ \mathbf{b}^{(1)} \in \mathbb{R}^{h} ] The output of the hidden layer therefore has the shape: [ \mathbf{A}^{(1)} \in \mathbb{R}^{h} ] For a batch of (m) examples, implementations may organize the dimensions differently depending on the framework. However, the

Scroll to Top