
Binary Searh Tree Visualization
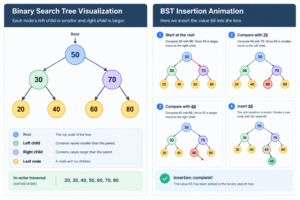
Learning data structures can feel difficult when you only read code and theory. Binary search tree visualization makes the process easier by turning abstract operations into something you can see.
Instead of imagining how nodes connect, you can watch a tree grow as you insert values. You can also see how searching, deletion, and traversal work step by step. This makes BSTs easier to understand for students, self taught programmers, and software engineering candidates preparing for interviews.
What Is a Binary Search Tree?
A binary search tree (BST) is a tree based data structure that stores values in an organized way. Each element sits inside a node, which can connect to up to two other nodes.
The top node is called the root. The nodes connected below it are called children. The child on the left is the left child, while the child on the right is the right child.
A BST follows one important ordering rule:
- Values smaller than a node go to its left.
- Values larger than a node go to its right.
- Duplicate values depend on the rules used by the particular implementation.
For example, suppose you insert:
50, 30, 70, 20, 40, 60, 80
The resulting tree looks like this:
          50
        /    \
      30      70
     /  \    /  \
   20   40  60   80
This structure makes searching more efficient when the tree stays reasonably balanced.
Why Binary Search Tree Visualization Matters
Reading a BST implementation can tell you what the algorithm does. However, a visual representation helps you understand why it works.
A binary tree visualization shows relationships between nodes directly. You can see which node acts as the root, where each child connects, and how the tree changes after every operation.
Visualization also helps you understand recursion. For example, when searching for 40, you start at 50. Since 40 is smaller, you move left to 30. Since 40 is larger than 30, you move right and find the value.
A visualizer can highlight this path as the algorithm runs.
It also makes time complexity easier to understand:
- Balanced BST: Search can take about O(log n).
- Unbalanced BST: Search can degrade to O(n).
- Insertion: Usually O(log n) in a balanced tree.
- Deletion: Usually O(log n) in a balanced tree.
This difference becomes much clearer when you watch a tree become balanced or turn into a long chain.
How a Binary Tree Visualizer Works
A binary tree visualizer converts the logical structure of a tree into a visual diagram. Most interactive tools let you enter values and watch the application create nodes and edges.
A typical visualizer can support:
- Inserting values.
- Searching for values.
- Deleting nodes.
- Animating tree traversal.
- Highlighting comparisons and paths.
- Showing the tree after each operation.
A good binary tree visualizer should let you control the animation. Step by step controls are especially useful because they let you pause after each comparison.
Insertion Animation
When you insert a value, the algorithm starts at the root.
Suppose the tree contains 50 and you insert 30.
- The algorithm compares
30with50. - Since
30is smaller, it moves left. - If that position is empty, it creates a new node there.
Now suppose you insert 70.
- Compare
70with50. - Since
70is larger, move right. - Create the node in the empty position.
A binary search tree visualizer can animate each comparison and movement. This helps you connect the code with the actual tree structure.
Deletion and Rebalancing
Deletion can feel more complicated because the algorithm handles three main cases.
Case 1: Leaf node
A leaf has no children. The algorithm can simply remove it.
Case 2: One child
If a node has one child, the algorithm connects that child to the node’s parent.
Case 3: Two children
If a node has two children, the algorithm usually replaces its value with a suitable value from its subtree. A common choice is the smallest value in the right subtree, known as the in order successor.
A visualizer can show these connections changing during deletion.
Note that a basic BST does not automatically rebalance itself. Balanced structures such as AVL trees and Red Black trees use additional rules to maintain better height.
Traversal Animation: In-order, Pre-order, Post-order
Traversal means visiting the nodes of a tree according to a specific order.
The three common depth first traversals are:
- In-order: Left → Root → Right
- Pre-order: Root → Left → Right
- Post-order: Left → Right → Root
In-order traversal has a special property in a BST. It visits values in sorted order.
For the tree above:
In-order:   20, 30, 40, 50, 60, 70, 80
Pre-order:  50, 30, 20, 40, 70, 60, 80
Post-order: 20, 40, 30, 60, 80, 70, 50
A visualizer can highlight each node as the traversal moves through the tree. This makes recursion and traversal order much easier to remember.
Best Binary Search Tree Visualizer Tools Online
When looking for a binary search tree visualization online, focus on features rather than a tool’s name.
A useful visualizer should provide:
- Interactive node insertion.
- Search and deletion operations.
- Step by step animation.
- Traversal visualization.
- Clear node and edge labels.
- Controls for pausing and restarting.
- Support for duplicate values or clear duplicate rules.
- Mobile friendly design.
- Accessible controls.
- Open source code if you want to study the implementation.
You should also test unusual inputs. Try inserting sorted values such as 10, 20, 30, 40, 50. This quickly shows how a BST can become heavily unbalanced.
Binary Search Tree Visualization Online vs. Building Your Own
Using an online visualizer is usually the fastest way to understand BST operations. You can focus on the data structure without spending time building the interface.
Building your own visualizer offers a different benefit. It forces you to understand both the algorithm and the visual representation.
For example, you could build a simple project using:
- Python + Matplotlib for basic diagrams.
- JavaScript + D3.js for interactive browser visualizations.
- HTML and CSS for the interface.
- JavaScript animations for step by step operations.
A personal BST visualization project makes an excellent programming exercise. Start with insertion, then add searching, deletion, and traversal animations.
Common Mistakes When Learning BST Visualization
Beginners often make a few predictable mistakes.
1. Confusing a Binary Tree With a BST
A binary tree can have two children per node without following any ordering rule. A BST specifically follows the left smaller, right larger rule.
2. Ignoring Tree Balance
A BST can look completely different depending on insertion order. A balanced tree can provide fast searches, while a badly unbalanced tree can behave like a linked list.
3. Ignoring Duplicate Values
Different implementations handle duplicates differently. Some reject them, while others place them consistently on one side.
4. Practicing Only Simple Examples
Do not stop with perfectly balanced trees. Test leaf deletion, deletion of nodes with one or two children, duplicate values, and sorted input.
Frequently Asked Questions
What is the difference between a binary tree and a binary search tree?
A binary tree allows each node to have up to two children. A binary search tree also has up to two children, but it follows an ordering rule that places smaller values on the left and larger values on the right.
What is a binary tree visualizer?
A binary tree visualizer is an interactive tool that displays tree nodes and their relationships. It can help you watch operations such as insertion, deletion, searching, and traversal.
Is binary search tree visualization useful for interview prep?
Yes. Visualization helps you understand insertion, deletion, recursion, traversal, tree height, and time complexity. These concepts frequently appear in technical interviews.
Can I build a binary search tree visualizer myself?
Yes. Building one makes a strong learning project. You can use Python with Matplotlib for simple visual output or JavaScript with D3.js for interactive browser based graphics.
Conclusion
A BST becomes much easier to understand when you can see every comparison, connection, and traversal step. Binary search tree visualization connects programming code with the structure that the algorithm creates.
Whether you use a binary search tree visualizer online or build your own project, practice different insertion orders and edge cases. Try a visualizer hands on, pause each operation, and explain why every node moves where it does. That active practice will help you build a much stronger understanding of BSTs and prepare you for data structures and algorithm interviews.